


Projecting Sea Level Rise
Now that you have an idea of how much sea level might rise, let's take a look at what this means for Rehoboth Beach and Cape Henlopen State Park.
Take a look at and explore the interactive maps below for a few minutes.
Step 3. Based on what you observed on the maps, predict the impacts of sea level rise, a local effect of climate change, on Rehoboth Beach and Cape Henlopen State Park. Think about how the impact will affect 1. human safety, 2. economic activity and tourism, and 3. ecosystems. Some things to consider are:
|
|
|
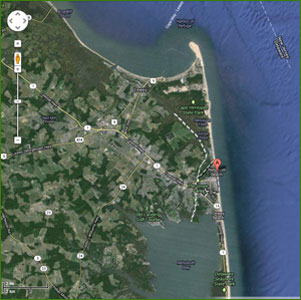
Use the two maps below to investigate the potential impacts of sea level rise. The first map provides satellite imagery to view landscape features, buildings, roads, etc.
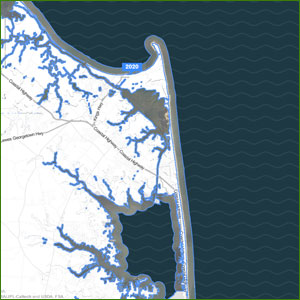
The second provides an interactive map of the same area and allows you to view the extent of sea level rise for different projections. Briefly note your observations from the two maps in your Online Sea Level Investigation Guide.
|
This map allows you to look at the actual satellite images for the Rehoboth Beach and Cape Henlopen State Park area. You can:
|
View Larger Interactive Map (New Tab)
This map allows you to look at the projected sea level rise in the Rehoboth Beach and Cape Henlopen State Park area. You can:
Interpreting the Map
|